Wenzhou Prance Hydraulic Equipment Co., Ltd

Reading Hydraulic Motor Torque–Speed Curves: Find a Sustainable Duty Point
A hydraulic motor torque speed curve is useful only when its test conditions, operating limits, and duty definitions match the application. Locate the required shaft speed and torque together, then check whether that point is permitted continuously, intermittently, or only as a brief peak. Confirm pressure difference, inlet flow, fluid condition, case pressure, and mechanical loading separately. A curve is not permission to combine every maximum value in a catalog. This guide explains how to read published motor information without inventing a performance curve for a product whose complete operating data have not been supplied.
First identify what the chart actually plots
Motor documents present several different kinds of charts. One may plot torque against speed, another efficiency against torque, and another allowable pressure against speed. A set of constant-flow or constant-pressure lines may appear on the same figure. Read the axis labels and units before interpreting the shape. Do not assume a familiar-looking curve uses the same variables as the last catalog you reviewed.
Check whether torque is measured shaft output or theoretical torque calculated from displacement and pressure. Check whether speed is actual shaft speed, a recommended limit, or a value inferred from flow. A theoretical relationship is useful for screening but cannot replace measured efficiency or starting behavior. Copying a theoretical line into a procurement comparison as a tested curve creates false precision.
The illustrations in this article deliberately show no A2FM performance curve. The exterior reference establishes product identity only. Obtain the full ordered motor’s data before plotting a real duty point against its envelope. A curve from another manufacturer, displacement, or shaft configuration cannot safely fill the missing information.
Read the conditions before reading the result
Look for oil viscosity or fluid grade, temperature, inlet conditions, outlet pressure, case pressure, and the test arrangement. These influence leakage, friction, lubrication, and heat generation. A performance point collected under one set of conditions may not predict a cold start, a hot continuous run, or operation with a restricted return line.
Find the displacement and configuration associated with the figure. A catalog may cover multiple frame sizes or options using adjacent charts. Confirm the document revision, units, notes, and footnotes. Where a curve is presented as typical rather than guaranteed, ask what tolerance or acceptance basis applies to the purchase. Do not silently treat a representative chart as an individual motor test certificate.
Record any missing condition as an unanswered question. If case pressure is absent, that does not mean it is unlimited. If external shaft loads are not discussed on the performance chart, seek the separate bearing-load information. The chart’s scope and the component’s full mechanical limits are different parts of the review.
Translate the application into a required duty point
Define the shaft torque and speed needed at the motor rather than starting from pump pressure and flow. For a geared drive, convert the load speed and torque through the actual ratio and efficiency. For a belt, wheel, or direct-coupled load, identify losses and external forces. Keep acceleration and steady running as separate conditions.
Mechanical output power is P = T n / 9550 in kilowatts for torque in Nm and speed in rpm. As a hypothetical example, 120 Nm at 750 rpm requires approximately 9.42 kW at the shaft. This is a load requirement, not a motor rating. It provides a consistency check when comparing the point with available hydraulic input power.
Repeat the process for the full cycle: startup, low-speed travel, normal working speed, reversing if applicable, and any short overload. Add the duration and repetition of each stage. A single average operating point can conceal a prohibited pressure peak or an extended low-speed condition that requires separate review.
Connect pressure and flow to torque and speed
For a displacement Vd in cm³/rev, theoretical torque is approximately Δp Vd / (20π) Nm when pressure difference is in bar. Actual output torque includes mechanical losses. The relevant pressure difference is measured across the working ports, not simply at the pump. Return restriction can reduce the useful differential while also imposing a separate outlet-pressure limit.
For inlet flow Q in L/min, actual motor speed can be represented for preliminary calculations by n = 1000 Q ηv / Vd, using an appropriate volumetric efficiency. Do not choose a constant efficiency merely because it makes the duty point fit. Obtain operating-point data or ask the manufacturer how to evaluate the required condition.
These relationships explain why pressure generally supports torque and flow supports speed, but a real chart includes losses and restrictions. If the calculated load power exceeds the available hydraulic power, the point cannot be achieved continuously. If the power balance appears plausible, the component’s detailed operating envelope still needs to be checked.
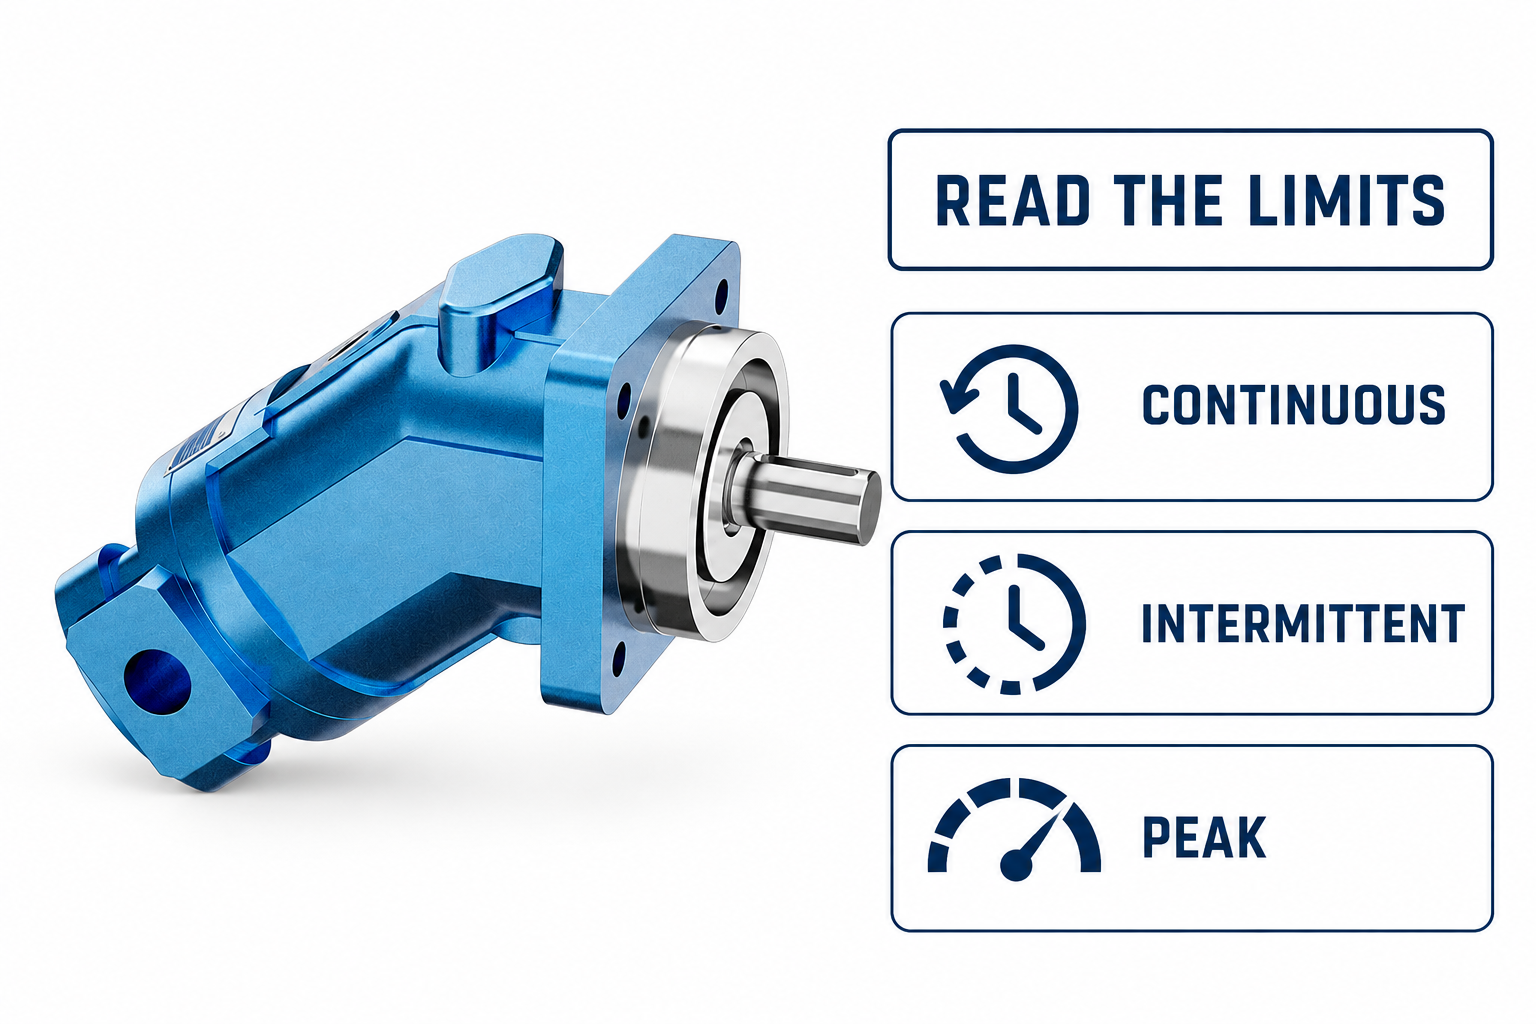
Distinguish continuous, intermittent, and peak regions
Continuous operation normally means a specified condition can be maintained within the manufacturer’s stated fluid, thermal, installation, and service conditions. It does not eliminate the need for adequate cooling, lubrication, cleanliness, or bearing-load checks. Read the exact definition in the applicable document rather than assuming the word covers every surrounding condition.
Intermittent operation requires a stated time basis. A supplier may define an allowed duration, recovery interval, fraction of a cycle, or other condition. Those definitions are not interchangeable. A short high-torque event repeated frequently may exceed a thermal or fatigue limit even though each event is brief. Record both event duration and repetition.
Peak limits are particularly easy to misuse. They may address a transient condition and may not permit useful operation at that value. Do not use a peak pressure to size a normal production duty. Where the chart or note is ambiguous, request written clarification with the actual duty cycle attached.
Use efficiency contours without overstating accuracy
An efficiency map can identify favorable regions, but first determine whether it shows volumetric, mechanical, or overall efficiency. These describe different losses. Volumetric efficiency concerns the relationship between supplied flow and displacement-related motion. Mechanical efficiency concerns the relationship between theoretical hydraulic torque and useful shaft torque. Overall efficiency connects useful output power with hydraulic input power.
Interpolate only when the manufacturer permits it and when the surrounding data support the intended estimate. Extrapolating beyond a plotted boundary can imply operation outside a tested or permitted range. If a point lies between sparse contours, report an estimate with its limitations instead of giving several decimal places that the chart cannot justify.
Loss power becomes heat in the component and circuit. A duty point in an inefficient region may require more cooling and may be less stable as oil warms. Compare the entire working cycle, especially if the motor spends long periods at low useful output while hydraulic input remains significant. Favorable nominal efficiency does not establish an acceptable system temperature.
Keep starting and minimum-speed behavior separate
A running torque curve does not necessarily establish starting torque. Breakaway friction, load orientation, pressure buildup, and leakage can affect the ability to start. If the application starts under load, obtain the manufacturer’s starting information for the actual condition rather than reading backward from a high-speed operating point.
Likewise, a plotted low-speed point does not guarantee smooth control at every lower speed. Minimum stable speed depends on motor design, load, fluid condition, supply stability, and the control circuit. Where uniform motion is important, specify allowable speed variation and how it will be measured. “Runs slowly” and “maintains the required low-speed accuracy” are different acceptance questions.
Reversing, overrunning, and braking duty also need separate information. The load may drive the motor, changing the energy path and makeup-flow requirements. A chart for motoring operation cannot automatically approve a braking circuit or establish a safe stopping time.
Review the evidence with a consistent table
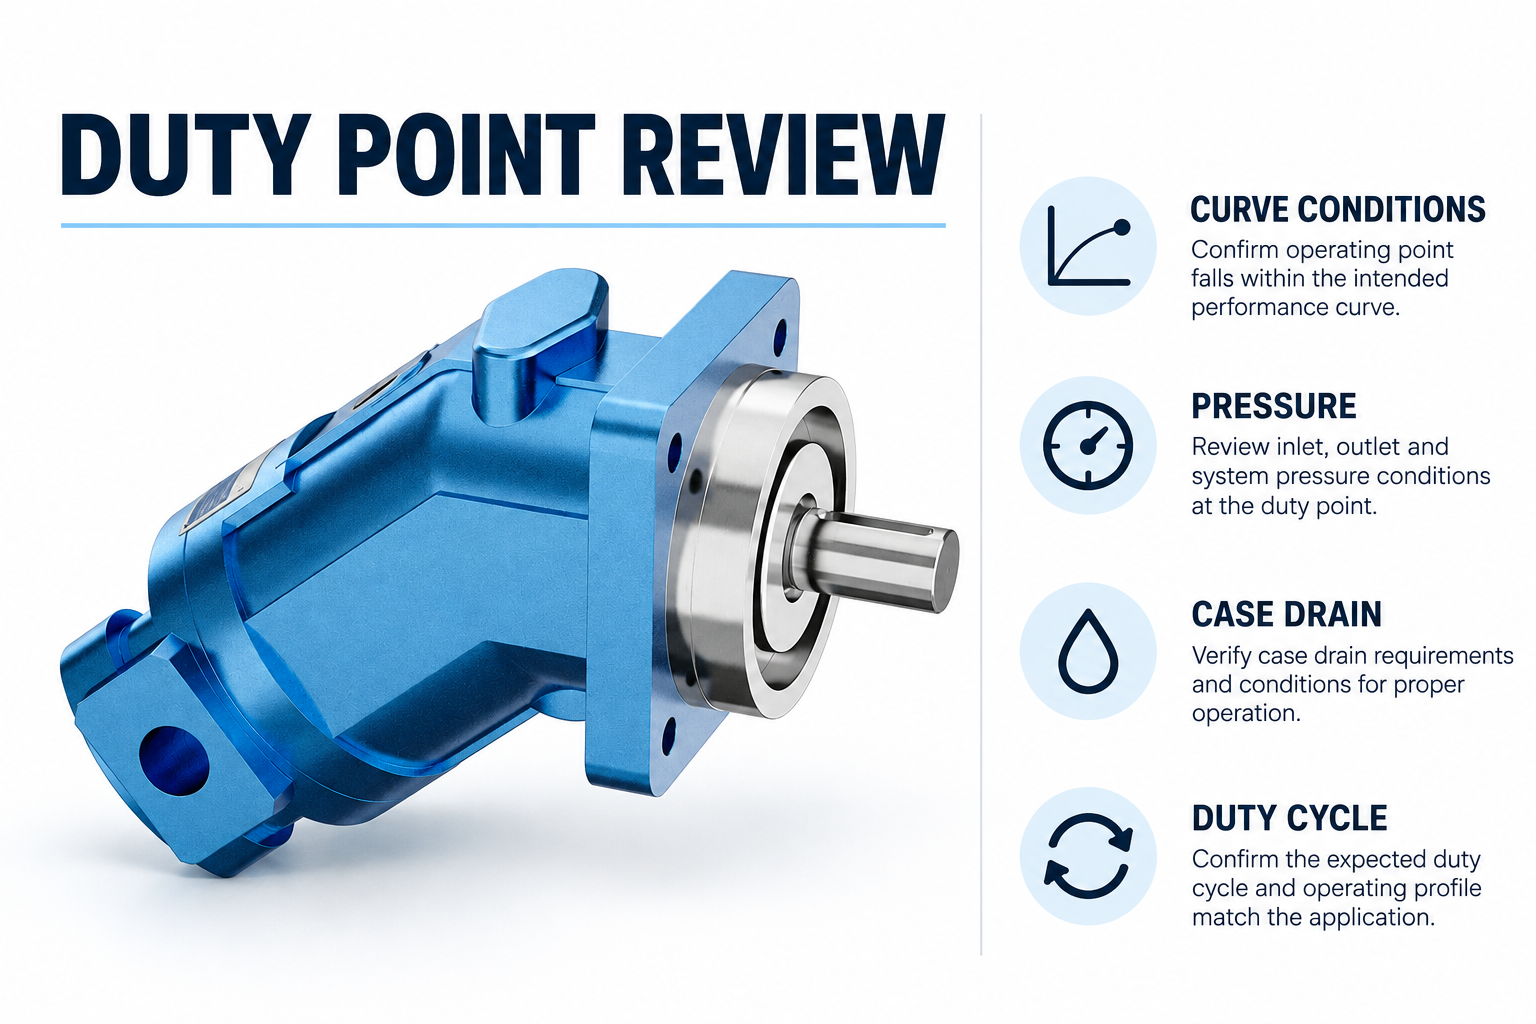
This qualitative table helps compare documents without inventing missing performance values. Use actual manufacturer data for all operating limits and use university fluid-power relationships only for the preliminary calculations described above.
| Question | What to read | What remains separate |
|---|---|---|
| Can it meet the shaft demand? | Actual output torque and speed together | Starting and acceleration duty |
| Is the point sustainable? | Continuous envelope and test conditions | System cooling and fluid management |
| Is an overload allowed? | Intermittent or peak definition and time basis | Repeated-event fatigue and heat |
| Is the flow sufficient? | Displacement and volumetric behavior | Supply losses and shared functions |
| Will slow motion be acceptable? | Minimum-speed and control information | Application accuracy and load variation |
| Can the shaft carry the load? | Separate bearing and shaft-load data | Coupling alignment and mounting design |
When comparing two candidates, keep assumptions, units, and duty definitions identical. If one document omits a condition supplied by the other, mark it unknown. Filling blank cells with estimates can make a comparison look complete while hiding the most important purchase risk.
Turn the review into an acceptance request
Send the supplier the required torque-speed points, durations, temperature range, fluid, pressure conditions, case-drain arrangement, shaft loads, and mounting details. Ask the supplier to identify the applicable chart and explain any restriction. Where data are typical, agree whether the order requires a documented performance test and what that test will measure.
For commissioning, establish safe measurement points and a controlled procedure before operation. Compare actual shaft speed, pressure difference, flow, temperature, and load with the proposed duty. Avoid changing several controls at once because that makes discrepancies hard to interpret. Isolate stored energy before inspection, following the equipment’s approved procedure and hazardous-energy precautions.
If measurements differ from the prediction, investigate input conditions and measurement locations before declaring the motor faulty. Low supply flow, excess return pressure, incorrect displacement identification, a load estimate error, or temperature-dependent leakage can all alter the result. Preserve the original curve, assumptions, and measured record so the supplier can review a concrete discrepancy.
Frequently asked questions
Can maximum torque and maximum speed be used together?
Only if the applicable manufacturer envelope explicitly permits that combined point under the stated conditions. Separate maximum figures may describe different operating conditions and cannot automatically be combined into one continuous duty point.
Is a theoretical torque line a performance curve?
No. It describes the displacement and pressure relationship before mechanical losses. A measured or manufacturer-published output curve includes defined conditions and may include limitations that a theoretical calculation does not show.
Why does temperature matter when reading the chart?
Temperature changes fluid viscosity and can affect leakage, friction, lubrication, and heat balance. Compare actual operation with the chart’s stated fluid conditions and obtain guidance where the application lies outside them.
Can I estimate a missing curve from another motor?
A different motor’s chart may help explain a concept but cannot establish the candidate’s approved performance. Obtain the correct displacement, configuration, revision, and operating data from the supplier before acceptance.
What if the duty point lies near a boundary?
Review operating variability, measurement uncertainty, temperature, transient loads, and the manufacturer’s duty definition. Request confirmation for the actual cycle rather than assuming a small numerical difference makes the condition acceptable.
Product and related engineering resources
The Fixed Displacement Motor A2FM catalog exterior is used as the real product reference in these explanatory images. It does not establish the approved service method, optional construction, or operating limits for an individual order. Confirm the complete code and its documentation. Related resources: Fixed Displacement Motor A2FM, hydraulic motor range, How should torque and speed shape a hydraulic motor review?, Radial Piston Motor Working Principle: Torque at Low Speed.
Sources and limits of this guide
University teaching supports physical and fluid-power principles; NIOSH supports hazardous-energy precautions. Calculations are hypothetical, not Prance ratings. The TI document, where linked, supports current-regulation principles only and is not a recommendation to use that circuit or its settings with the illustrated valve. No curve, pinout, attachment approval or model-specific frequency is inferred from the catalog exterior.
- UNSW Physics: rotational inertia, torque and kinetic energy
- NPTEL: Industrial Oil Hydraulics and Pneumatics
- NIOSH: hazardous-energy injury prevention
University lesson: operating principles
NPTEL-NOC IITM presents 6.3 – Hydraulic Motors. The lesson supports the hydraulic motor flow, pressure and torque behavior, without establishing a model-specific curve used in this discussion; it is not a model-specific performance or installation approval.