شركة ونزهو برانس للمعدات الهيدروليكية المحدودة

Reading Hydraulic Pump Efficiency Maps: Match the Duty Point
A hydraulic pump efficiency map is useful only when its pressure, speed, displacement, fluid condition, and efficiency definition match the proposed duty point. Read those conditions before comparing contour values. For a machine that changes load during a cycle, estimate input power at each important operating state and add the energy over time. Choosing the highest percentage printed on a map can select the wrong pump if that efficient region is rarely used or the chart represents a different displacement setting. A product photograph or a nominal efficiency claim cannot replace a verified performance map.
1. Confirm that the chart describes a hydraulic power pump
Search results for pump efficiency often mix positive-displacement hydraulic pumps with centrifugal water pumps. Their charts answer different operating questions. An industrial hydraulic power pump may be evaluated at pressure difference, shaft speed, and displacement setting. A centrifugal pump chart commonly relates flow and head, with a best-efficiency point for that particular curve. Do not transfer a water-pump selection rule directly to an axial-piston hydraulic pump.
Start with the full document identification: family, size, revision, circuit type, and control configuration. Check whether the chart is measured, typical, simulated, or scaled from another unit. Research maps are useful for understanding the method, but the contour values belong to the investigated components and conditions. They are not substitute test results for a Prance pump.
The IFK hydrostatic-drive paper and the university proceedings listed below illustrate why operating conditions matter. Both discuss efficiency across operating regions rather than a universal percentage. Use them to understand map reading, then request applicable data for the unit being purchased.
2. Identify which efficiency is plotted
Overall pump efficiency compares useful hydraulic output power with mechanical input at the pump shaft. Volumetric efficiency concerns delivered flow relative to theoretical displacement flow. Hydromechanical efficiency accounts for the torque-related part of the conversion loss. A high volumetric-efficiency contour does not establish the same overall efficiency.
Write the chart’s definition beside the selected point. If the supplier provides separate volumetric and hydromechanical values, check that both apply to the same pressure, speed, displacement, and fluid condition before combining them. Multiplying the best value from one chart by the best value from another operating point produces a result that was never measured.
Also define the measurement boundary. Pump-shaft efficiency excludes an electric motor, inverter, gearbox, or engine upstream. It also excludes downstream throttling and line losses unless the document explicitly includes them. A pump map cannot by itself establish total machine efficiency or electrical consumption.
3. Read axes, slices, and restrictions before contours
A two-dimensional map can display only two changing quantities. If the axes are pressure and shaft speed, displacement and other test conditions must be held fixed or otherwise defined. A separate map may be needed at partial displacement. Similarly, a map with displacement on one axis may apply at only one shaft speed.
Check whether speed is expressed in revolutions per minute or as a percentage of a stated reference speed. Determine whether pressure means outlet gauge pressure or the pressure difference across the pump. A percentage of an unspecified maximum is not an actionable operating point. Ask for the underlying reference rather than guessing.
Read restrictions independently of the efficiency contours. A colored region does not override continuous pressure, intermittent duration, inlet, case-pressure, shaft-speed, or temperature limits. Missing contours can indicate missing test data; they are not permission to extrapolate into that area. Select a feasible operating point first, then assess its efficiency.
4. Place the actual duty point on the correct map
Use the measured or designed pressure difference at the pump and the actual shaft speed. For a variable-displacement pump, identify the commanded and effective displacement relevant to that state. If only output flow is known, account for the difference between theoretical displacement flow and delivered flow when determining the operating setting.
Locate the point on the corresponding chart and identify its surrounding contours. Report a range when the plotted resolution does not justify a precise value. For example, a point between contours labeled 86% and 88% should not automatically be reported as 87.43%. Measurement uncertainty and reading uncertainty remain even when software draws smooth colors.
Interpolation should follow the supplier’s method or an explicitly stated engineering approximation inside the documented region. Do not interpolate across a discontinuity in control mode or combine charts taken at incompatible conditions. If a critical point lies outside the supplied coverage, request additional test information or calculate a conservative scenario with clearly labeled assumptions.
5. Build a duty-cycle comparison instead of a peak ranking
Divide the machine cycle into operating states that contribute meaningfully to energy or constrain the component. A short high-pressure event may determine rating, while a longer moderate-load state dominates energy use. Standby, unloading, and low-displacement operation deserve separate treatment because useful output and losses can behave differently there.
The following qualitative table is an author-developed review method based on the operating-point dependence described in the IFK and university research. It contains no product ratings.
| Operating state | Information to establish | Map-reading decision |
|---|---|---|
| Loaded working stroke | Pressure difference, flow, speed, duration | Use the matching displacement slice and overall efficiency |
| Fast low-load movement | Required flow and available shaft speed | Check speed and inlet limits before comparing efficiency |
| Partial-displacement running | Actual setting and control mode | Do not reuse a full-displacement map without support |
| Standby or near-zero delivery | Measured input loss and standby duration | Use loss or input-power data when efficiency becomes unhelpful |
| Brief peak demand | Peak pressure, duration, temperature, repeat rate | Check permissible operation separately from energy ranking |
| Warm steady operation | Stabilized fluid condition and representative load | Compare candidates on the same thermal basis |
cURL Too many subrequests by single Worker invocation. To configure this limit, refer to https://developers.cloudflare.com/workers/wrangler/configuration/#limits.
cURL Too many subrequests by single Worker invocation. To configure this limit, refer to https://developers.cloudflare.com/workers/wrangler/configuration/#limits
cURL Too many subrequests by single Worker invocation. To configure this limit, refer to https://developers.cloudflare.com/workers/wrangler/configuration/#limits.
cURL Too many subrequests by single Worker invocation. To configure this limit, refer to https://developers.cloudflare.com/workers/wrangler/configuration/#limits.
cURL Too many subrequests by single Worker invocation. To configure this limit, refer to https://developers.cloudflare.com/workers/wrangler/configuration/#limits.
cURL Too many subrequests by single Worker invocation. To configure this limit, refer to https://developers.cloudflare.com/workers/wrangler/configuration/#limits.
cURL Too many subrequests by single Worker invocation. To configure this limit, refer to https://developers.cloudflare.com/workers/wrangler/configuration/#limits
cURL Too many subrequests by single Worker invocation. To configure this limit, refer to https://developers.cloudflare.com/workers/wrangler/configuration/#limits.
cURL Too many subrequests by single Worker invocation. To configure this limit, refer to https://developers.cloudflare.com/workers/wrangler/configuration/#limits.
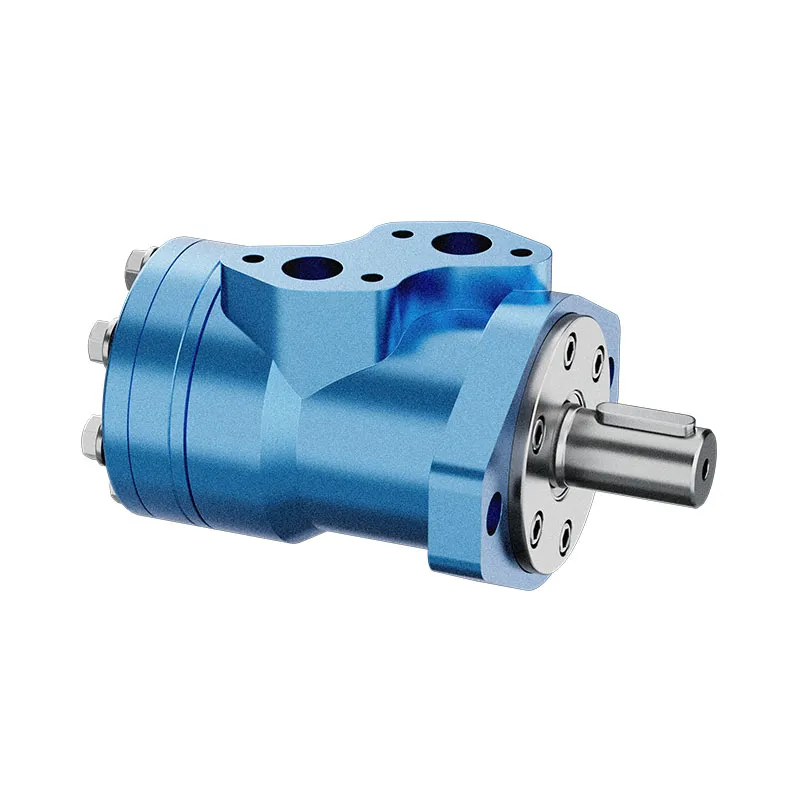
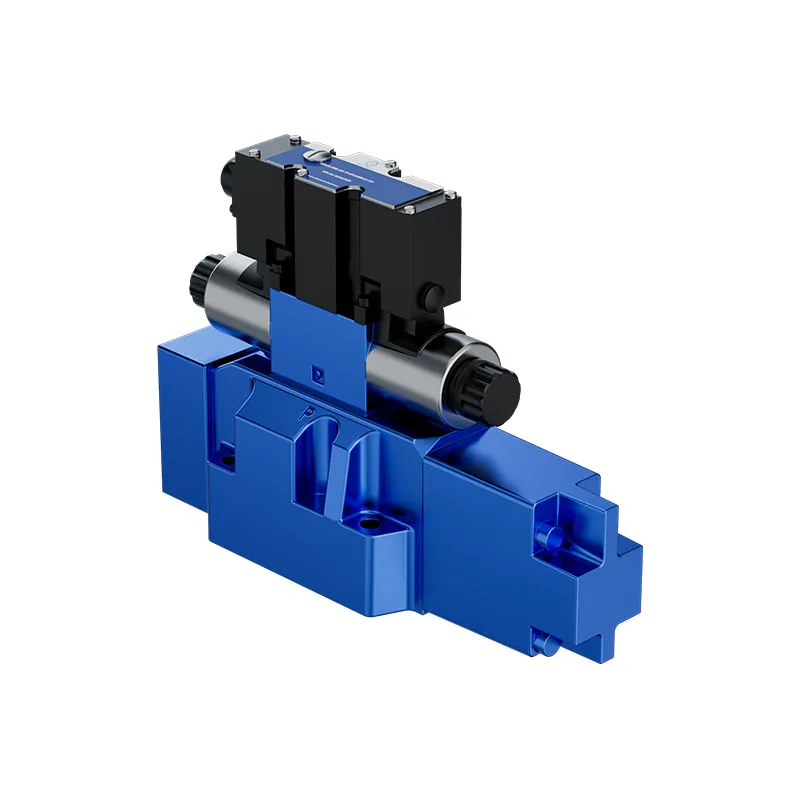
The Prance A10VO 31 product page describes an open-circuit variable-displacement axial-piston pump. That establishes the relevant product category for this discussion. It does not provide the efficiency map used in this article, and the original exterior images do not prove any specific contour value. Request data for the actual size and control configuration before comparing suppliers.

8. Validate measurements and uncertainty
A field comparison needs synchronized pressure, delivered flow, shaft speed, and input measurements taken at representative fluid conditions. Define instrument locations and the energy boundary. A pressure reading downstream of a restrictive valve can understate the pump’s pressure rise; an electrical input measurement includes losses absent from a shaft-only map.
Use suitable calibrated instruments and follow the machine’s approved test procedure. Do not add unsafe restrictions or exceed limits to reach a convenient chart point. Separate warm steady-state results from cold-start observations. If the predicted saving is smaller than measurement and operating variation, report the comparison as inconclusive rather than a proven benefit.
For the request to a supplier, provide the cycle states and their durations, fluid and temperature basis, required flow and pressure, available speed range, and installation constraints. Ask for the map revision, tested displacement slices, efficiency definition, and supporting input-power data. That package turns a headline efficiency claim into a comparison that can be reviewed.

الأسئلة الشائعة
Can I use a full-displacement map at half displacement?
Only if applicable documentation supports that use. Displacement changes can alter the relationship between output and losses. Obtain the matching partial-displacement map or loss data rather than copying the full-displacement percentage.
Is the highest contour always the best operating point?
No. The point must deliver the required task within all component and system limits. Its importance also depends on time spent there and on the performance of the prime mover and downstream circuit.
Can volumetric efficiency predict the electricity bill?
No. It does not include all pump losses, upstream drive losses, standby energy, or the machine duty cycle. Define the measurement boundary and use overall input energy for the required useful work.
What if the supplier has no map for the proposed pump?
Request applicable measured input-power and delivered-flow data at the critical duty points. Keep missing information explicit. Do not substitute another brand’s chart or imply that a generic efficiency range proves the offered unit’s performance.
Should two nearly identical calculated energy totals decide the purchase?
Not by themselves. Check uncertainty, operating variation, rating compliance, controllability, service support, and installation fit. Small calculated differences based on assumed efficiencies are a reason to obtain better evidence, not a verified saving.
موارد المنتج والهندسة ذات الصلة
مضخة إزاحة متغيرة الأصلية A10VO سلسلة 31, نطاق منتجات المضخة الهيدروليكية, ما الذي يمكن للمشترين مقارنته عند تقييم كفاءة المضخات الهيدروليكية؟, التوازن الحراري لنظام الهيدروليك: تقدير توليد الحرارة. تأكيد رمز المنتج الكامل ومتطلبات التطبيق عند طلب مراجعة التكوين.
Technical references
- IFK 2012: hydrostatic driveline efficiency maps and operating-point optimization
- Kaunas University of Technology: ITELMS 2016 proceedings, pump operating maps
- US DOE OSTI research report: hydraulic pump efficiency definitions
تعلم إضافي: مضخات هيدروليكية
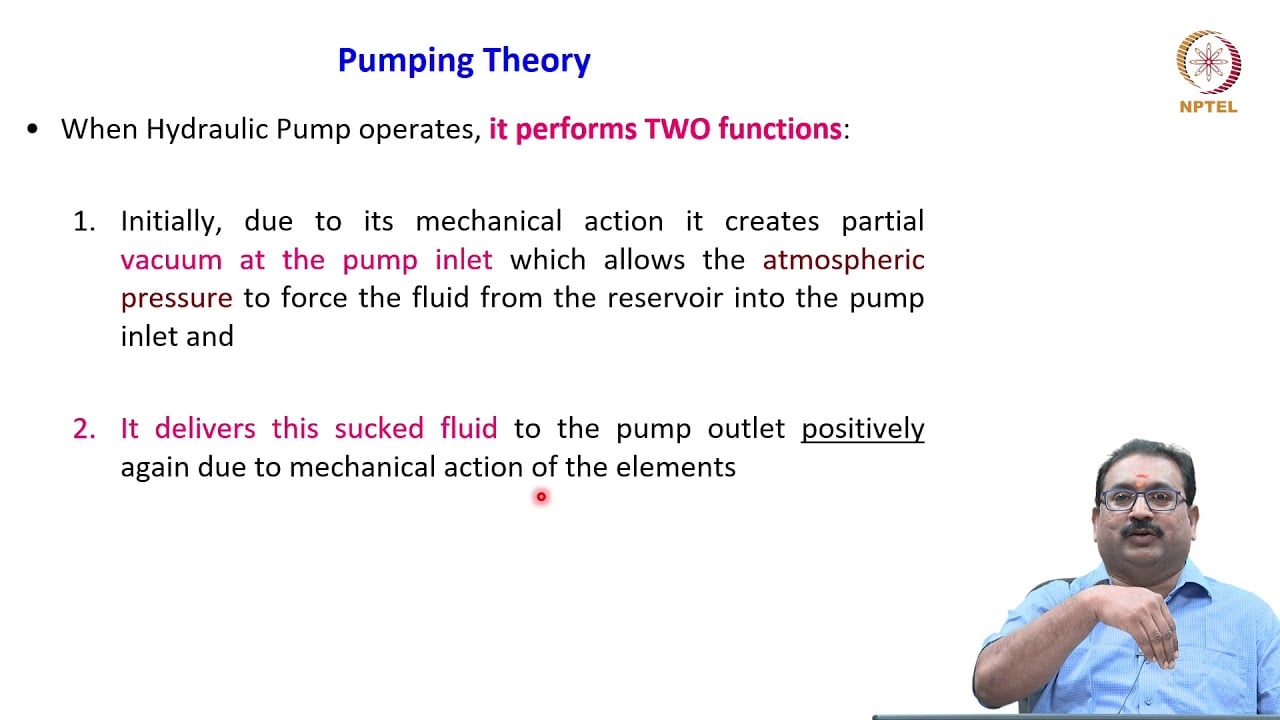
3.2 – Hydraulic Pumps by NPTEL-NOC IITM provides background on pump operating principles. The pump operating principles provide context for pressure, flow, speed and displacement. Exact efficiency contours require the applicable pump test data. It supplements the component fundamentals; it is not a test procedure for the complete circuit discussed above.