Wenzhou Prance Hydraulic Equipment Co., Ltd.

Frecuencias de vibración de la bomba hidráulica: velocidad del eje, engranaje de malla y resonancia
Hydraulic pump vibration frequencies help separate rotating excitation from the structure that amplifies it. Calculate shaft frequency from actual revolutions per minute, calculate gear-mesh frequency only when tooth count is verified, and compare the spectrum with simultaneous operating conditions. A peak at one expected frequency is a clue, not a complete fault diagnosis. The same excitation may look severe on a flexible bracket and modest on the pump housing.
This guide focuses on external gear-pump vibration and measurement planning. It complements pressure-ripple analysis without treating every vibration peak as a hydraulic defect. Use machine-specific operating and alarm limits. Do not run through an excessive-vibration condition merely to complete a spectrum, and install or move sensors only using a safe procedure.
Start with actual speed and the drive arrangement
The shaft-frequency calculation is straightforward: f_shaft = n / 60, where n is rotational speed in rpm and frequency is in hertz. Use measured pump-shaft speed rather than the nominal motor label. A gearbox, belt drive, variable-frequency drive, or engine governor can make the difference relevant to diagnosis.
Order expresses frequency relative to shaft speed. A 1X component occurs once per revolution; 2X occurs twice. This makes spectra easier to compare across different speeds. A line that moves proportionally with rpm is consistent with an order-related excitation. It still does not identify imbalance, misalignment, or another mechanism by itself.
Draw the drive chain before assigning frequencies. A geared drive has its own tooth-mesh frequencies in addition to the pump’s. Record which shaft supplies the speed reference. A spectrum referenced to the electric motor may place a pump-related component at an unexpected order when the drive ratio is not one to one.
Calculate gear mesh without guessing the tooth count
For a simple external gear pair, f_mesh = z × n / 60, using the tooth count z and rotational speed n of the same gear. The expression counts tooth engagements per second; it is a kinematic relationship rather than a product performance claim. An exterior photograph does not reveal the tooth count, and displacement alone is insufficient to calculate it.
As an illustrative calculation, assume a pump shaft runs at 1,800 rpm and its verified driving gear has 12 teeth. Shaft frequency is 30 Hz and gear-mesh frequency is 360 Hz. At 1,500 rpm, those values become 25 Hz and 300 Hz. These are assumed teaching inputs, not specifications for Prance’s HDH pump.
A peak near 360 Hz in the first example deserves investigation, but proximity alone is insufficient. Check frequency resolution, actual speed variation, other gears, and possible electrical sources. Use manufacturer information or approved service records for tooth count. Do not dismantle a functioning pump merely to fill in a diagnostic spreadsheet.
Separate excitation from resonance
Excitation is the repeating force or pressure variation driving the motion. Resonance is amplification when that forcing acts near a natural frequency of the installed structure. The Hydraulic Institute discussion listed below explains this distinction for pumping machinery. Its rotodynamic examples provide general dynamics background, not gear-pump acceptance limits.
A gear-mesh line usually changes frequency with speed. A structural natural frequency is associated with the assembled mass, stiffness, supports, and boundary conditions. During a permitted change in speed, vibration can rise sharply where a moving excitation approaches a structural response. The frequency pattern and amplitude pattern must therefore be considered together.
A new mounting plate, pipe support, guard, or bracket can change the observed response even when the pump is unchanged. Record those changes before attributing the increase to internal wear. Conversely, a visibly flexible structure does not prove that the pump is healthy. There may be both a stronger excitation and an installation that amplifies it.
Use a frequency map to plan the next check
The table is a qualitative screening aid. Frequency equations are definitions, while the interpretations require confirmation from measurements and the actual machine. No row establishes an allowable vibration level or authorizes a repair by itself.
| Spectrum observation | What it may indicate | Useful confirming evidence |
|---|---|---|
| A line tracks pump-shaft 1X | A shaft-synchronous source | Actual rpm, direction of motion, phase where available, and installation condition |
| A line tracks verified tooth count times shaft frequency | Gear-related periodic excitation | Verified tooth count and separation from any drive-gear mesh |
| Harmonics appear at multiples of a main line | A non-sinusoidal or nonlinear response | Time waveform, mounting condition, and trend at matching duty |
| Sidebands surround a mesh-related line | Modulation of the repeating excitation | Sideband spacing, speed reference, and independent condition evidence |
| Large response occurs in a narrow speed region | Possible resonance amplification | Approved speed comparison and structural review |
| Broad vibration increases with changing inlet conditions | Possible hydraulic or flow-related contribution | Inlet pressure, fluid condition, temperature, and synchronized operating observations |
Do not assign one fault name to each row. For example, a 1X peak can appear in several mechanical conditions, and a mesh-frequency peak can exist on a serviceable pump. Trend and context are what make the spectral evidence useful.
Make measurement positions repeatable
Choose rigid, accessible measurement locations approved for the equipment. Document location, orientation, sensor type, mounting method, and cable routing. A measurement on a thin cover is not directly interchangeable with one on a solid housing. Repeating the same location matters when judging a change over time.
Consider radial directions and the axial direction where the arrangement and access permit. Include the driver and base when the purpose is to distinguish a pump source from transmission through the installation. The largest reading may occur away from the source because the structure amplifies motion locally.
Attach sensors and route cables with the machine isolated whenever required. Keep guards in place during running measurements and avoid loose cables near couplings or shafts. Do not hold a probe against an unsafe rotating assembly or use a hydraulic pipe as a convenient hand support. If the necessary point cannot be reached safely, change the measurement plan.
Check the instrument settings before interpreting peaks
Acceleration, velocity, and displacement describe different aspects of vibration. State the quantity, unit, and amplitude convention, including whether the result is RMS or peak. A numerical increase across two reports is meaningless if one report uses acceleration peak and the other uses velocity RMS over a different bandwidth.
Set an acquisition bandwidth that includes the frequencies of interest, using a sensor and mounting method suitable for that range. Apply appropriate anti-aliasing and use the recorder manufacturer’s guidance. Choose frequency resolution that can separate the expected features, and preserve enough time history to understand events that do not remain steady.
Speed variation during a record can smear a narrow order-related feature across several frequency bins. For variable-speed operation, an analyst may need an accurate speed reference and order tracking. Do not interpret a broadened line as damage until acquisition effects have been considered. Store the original data so processing choices can be reviewed later.
Compare pressure, vibration, and the operating state
A casing accelerometer measures structural motion, while a pressure transducer measures a fluid-pressure signal at its connection. The signals are related through the machine but are not interchangeable. A pressure-ripple increase can excite vibration, and a flexible support can amplify motion without a proportional rise in measured pressure ripple.
Compare matched operating points. Record speed, outlet pressure, inlet condition, fluid temperature, and the active machine function. A before-and-after spectrum taken under different loads can suggest a deterioration that is actually a duty change. Note whether the event occurs during steady running, unloading, reversal, or a temperature transition.
The Hydraulic Institute troubleshooting guidance emphasizes trends and multiple operating parameters. Apply that reasoning to the gear-pump circuit while keeping its technology-specific limits separate. If the vibration changes with inlet conditions, review aeration and supply restrictions using an approved hydraulic diagnostic procedure. A spectrum alone cannot distinguish every fluid-related mechanism.

Use product photographs for identification only
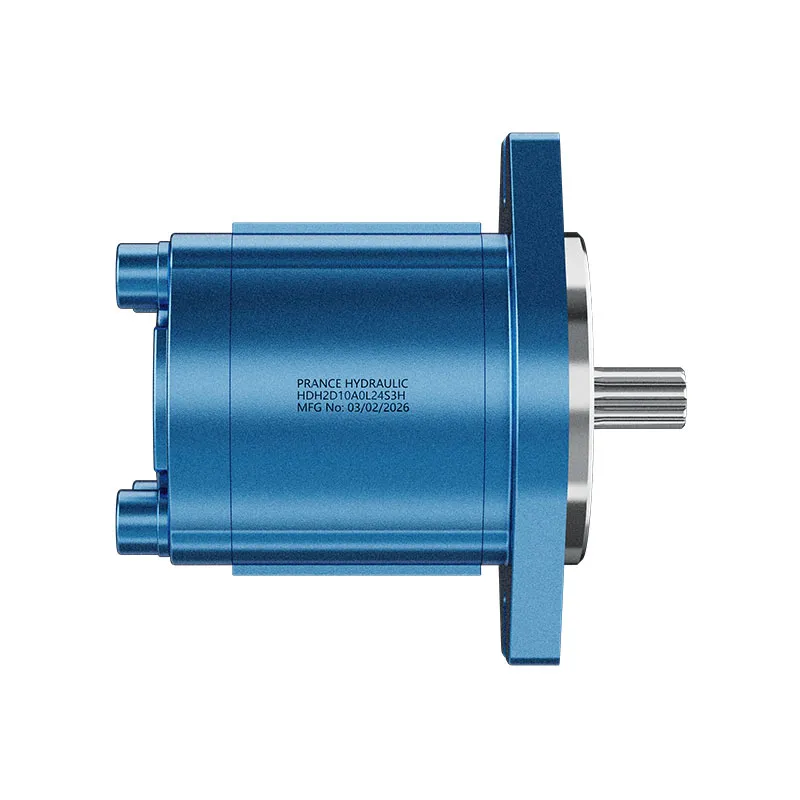
Prance lists the HDH product as an external gear pump. Its original exterior views are useful for discussing the supplied item’s mounting, shaft, and port arrangement with a supplier. They do not establish the number of teeth, the pump’s natural frequencies, or a vibration acceptance threshold.
The page’s legacy descriptive text includes unrelated cylinder terminology. This article does not use that text as evidence for internal pump construction. Obtain the correct model documentation before assigning internal features or ratings. This distinction prevents an unrelated catalogue phrase from becoming a false engineering claim.
When requesting a replacement or investigation, provide the complete model identification and installation photographs together with the measurement evidence. Do not ask the supplier to diagnose an internal gear fault from a single exterior picture or an unlabelled spectral screenshot. The product context and the condition evidence answer different questions.
Decide between installation work and component investigation
If measurements point toward a local structural response, inspect supports, fasteners, base condition, and pipe loading with the machine isolated. Use the documented tightening and alignment procedures. Randomly tightening bolts or adding stiffness can shift the response and create new loads without fixing the source.
If a mesh-related component has grown under matched conditions, compare its harmonics, sidebands, waveform, and trend with other evidence such as oil condition or functional change. Ask a qualified analyst or the manufacturer to review the combination before condemning the pump. A stable mesh line that has always existed is different evidence from a rapidly changing pattern.
After any corrective work, repeat the same measurement arrangement and operating conditions. Verify other permitted speeds and loads as appropriate, and retain both data sets. Acceptance should use the documented equipment limits and the original complaint: reduced damaging vibration, stable hydraulic operation, and no new mechanical or thermal problem.
Preguntas frecuentes
¿Es una pico de malla de engranajes una prueba de dientes dañados?
No. El engrane de los dientes genera una excitación periódica incluso durante el funcionamiento normal. Para determinar si existe una avería, se necesitan tendencias en condiciones equivalentes, características espectrales de apoyo y pruebas independientes obtenidas de la máquina instalada.
¿Puedo calcular el acoplamiento de engranajes a partir del desplazamiento de la bomba?
No. Displacement does not uniquely identify tooth count. Use verified gear information and the corresponding gear speed, or leave the mesh frequency unassigned until that information is available.
¿Por qué la vibración es peor a solo una velocidad?
Una excitación dependiente de la velocidad puede acercarse a una frecuencia natural estructural. Otros cambios en la operación también pueden contribuir, por lo que compare la velocidad, carga, presión y posición de medición antes de concluir que la resonancia es responsable.
¿Se pueden utilizar los límites de vibración de la bomba centrífuga para esta bomba de engranajes?
Do not transfer them automatically. The pump type, installation, measurement quantity, and applicable documentation must match. General dynamics guidance does not establish an HDH acceptance threshold.
¿Qué debe acompañar a un informe de vibraciones para el proveedor?
Include model identification, drive ratio, actual speed, verified tooth count if available, sensor locations, units, bandwidth, waveform, spectrum, operating pressure and temperature, and the history of the complaint.
Recursos relacionados de productos e ingeniería
Bomba de engranajes externos HDH, gama de productos de bombas hidráulicas, Rizado de presión en bombas de engranajes hidráulicas: efectos del número de dientes y del ruido, Aumento de la entrada de la bomba: Cuando un refuerzo resuelve más que una línea de succión más grande. Confirmar el código completo del producto y los requisitos de aplicación al solicitar una revisión de configuración.
Referencias técnicas
- Hydraulic Institute: excitation and resonance
- Hydraulic Institute: vibration measurement and diagnosis
- Research: gear-pump vibration and noise separation
- Vibration Institute: pump vibration review
University lesson: hydraulic pumps
3.3 – Hydraulic Pumps by NPTEL-NOC IITM provides background on pump operating principles. External gear engagement and pumping operation explains the repeated tooth events used in the frequency calculation; not a measured spectrum. It supplements the component fundamentals; it is not a test procedure for the complete circuit discussed above.